Having struggled too much with Open/Libre-Office spreadsheets lack of the possibility to save graph settings (and NO zoom on graphs), then this little program might be helpful. And it is absolutely free, as in free beer
My first thought was to dig into the code base of LibreOffice and make a little menu extension so one could save the default graph settings for the next time, but after a few hours, I decided it would be faster if I mocked something together my self. And so I did. The work is far from finished but very useful for me when I need to analyze new data sets in the same CSV format.
‘Feature set’ :
- Can handle huge CSV files
- Tested with 1280000+ rows (Yes, more than one million!), enough for me, kills a LibreOffice or an Excel spreadsheet 🙂
- Read and save CSV files
- Append CSV files
- Read and save spreadsheet files
- Fast graphing, very, very fast indeed
- Two vertical axis
- Also X-Y graph
- Zoom in with history. Cool
- A few choices for colors
- Print out of graphs
- Tested on XP, Win7 and Win8/8.1. Sorry, not Linux – yet.
- NO fooling around in the registry database, just copy the exe file to where you want it and run it
To zoom in on the chart: Left click and drag right/down.
To zoom out: Left click and drag left/up
To get information about a data point: When the cursor turns into a hand, right click.
Unfortunately, I can not offer it with source as I am using some paid components.
Click on the link to download the zip file including a few test files CSV_to_SpreadsheetGraph This is an older version. See below for the latest update
Enjoy.
Suggestions and comments are appreciated.
Disclaimer: I will update the program as it progresses – on a non-regularly basis.
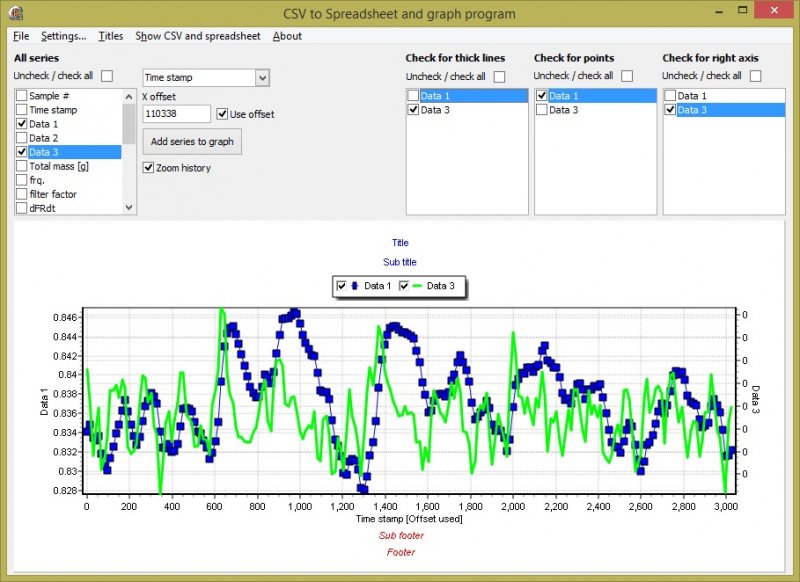
A few screenshots


2014-04-19
Latest version available here CSV_2_SpreadsheetGraph_XE5
Above zipped file only have one HUGE sample CSV file of real world data (guess what the data represent !). For more examples, also download the first version, just ignore the exe file.
The latest CSV to Spreadsheet utility now have support for “” and ” as well as ;
So it will work with a comma as decimal separator and a semicolon as value separator.
Suggestions and bug reports are appreciated.
The latest release is now ready. Tested with 1.28 million data points.
Empty lines can be deleted from the CSV file.
Also check out the test feature. It generates 2.56 million data points!
I’m impressed with the speed and possebilities of CSV to graphs.
But what I miss is the possebility of a date/timestamp at the X-as. Or is there a trick for this.
Using a sample # and a click to get the timestamp of one point is not where I am looking for.
Hi Jan,
Thank you for your interest in this gadget and for your kind words.
I will work on your great suggestion but please be patient 🙂
Cheers,
Claus